|
This is unreleased documentation for SUSE® Rancher Manager v2.16 (Unreleased). |
Monitoring and Dashboards
Rancher Monitoring Dashboards
|
Starting in Rancher v2.15.0, new monitoring installations use the decoupled Rancher maintains the legacy |
The rancher-monitoring-dashboards chart provides Grafana dashboards and Rancher UI integration for external Prometheus monitoring stacks, such as kube-prometheus-stack.
-
No bundled runtime: Operates without depending on Rancher-shipped
kube-prometheus-stackimages or components. It operates independently and does not require installing the legacyrancher-monitoringchart. It installs a dashboard-only version ofrancher-monitoring. -
Prerequisites: Requires uninstalling the
rancher-monitoringchart and using a Prometheus infrastructure. Although several configurations are supported, installingkube-prometheus-stackis the simplest method.
Migrating from rancher-monitoring to rancher-monitoring-dashboards
Follow these steps to migrate to rancher-monitoring-dashboards:
-
Uninstall the
rancher-monitoringchart. See Uninstall Monitoring. -
Install your own
kube-prometheus-stack. See Install thekube-prometheus-stackchart. -
Install
rancher-monitoring-dashboards. See Installrancher-monitoring-dashboardschart.
If you need to preserve or migrate existing data, refer to the official Grafana and Prometheus documentation:
Rancher Monitoring Dashboards Installation
This section guides you through setting up your Prometheus stack and installing the rancher-monitoring-dashboards chart using the SUSE Application Collection (AppCo).
Create the AppCo credentials
First create the secret that will be used by Kubernetes to pull the images and login to Helm to pull the required chart from SUSE AppCo. The secret needs to be created in the cattle-monitoring-system namespace where the chart is installed.
Run the following commands to create the secret:
kubectl create namespace cattle-monitoring-system

kubectl create secret docker-registry application-collection --docker-server=dp.apps.rancher.io --docker-username=<your_username> --docker-password=<your_password> --namespace cattle-monitoring-system
Run the following command to login to Helm, replacing <your_username> and <your_password> with your SUSE AppCo credentials:
helm registry login dp.apps.rancher.io -u <your_username> -p <your_password>Install the kube-prometheus-stack chart
-
Create the
kube-prometheus-stackvalues.yamlfile. Configure the file with the following required settings to ensurekube-prometheus-stackintegrates properly and supports embedded dashboards inrancher-monitoring-dashboards.grafana: # NOTE: Do NOT set root_url or serve_from_sub_path here! grafana.ini: security: allow_embedding: true auth: disable_login_form: false auth.anonymous: enabled: true org_role: Viewer dashboards: default_home_dashboard_path: /tmp/dashboards/rancher-default-home.json users: auto_assign_org_role: Viewer # Prometheus configuration to pick up all ServiceMonitors prometheus: prometheusSpec: serviceMonitorSelectorNilUsesHelmValues: false podMonitorSelectorNilUsesHelmValues: false # No metric exporter by default kubeEtcd: enabled: true serviceMonitor: enabled: false kubeControllerManager: enabled: true serviceMonitor: enabled: false kubeScheduler: enabled: true serviceMonitor: enabled: false kubeProxy: enabled: true serviceMonitor: enabled: false -
Install the
kube-prometheus-stackchart in thecattle-monitoring-systemnamespace through the Rancher UI or via the Helm CLI, applying thevalues.yamlfile from the previous step:-
UI
-
Helm
-
Select ☰ > Cluster Management.
-
Locate your cluster and click Explore.
-
In the left navigation menu, select Apps > Charts.
-
Locate and select the kube-prometheus-stack chart.
-
Click Install this version.
-
In the Namespace dropdown, select cattle-monitoring-system. If the namespace does not exist:
-
Select Create a New Namespace and enter
cattle-monitoring-system. -
In the Name field, enter
kube-prometheus-stack. -
Select Customize Helm options before install.
-
-
Click Next.
-
Select Edit YAML and paste or upload your
values.yamlfile. -
Click Next.
-
Select and specify additional deployment options.
-
Click Install.
helm install kube-prometheus-stack oci://dp.apps.rancher.io/charts/prometheus-operator \
  --namespace cattle-monitoring-system \
  --create-namespace \
  --debug \
  --wait \
  --set global.imagePullSecrets={application-collection} \
  -f values.yaml
Result: The Prometheus monitoring infrastructure is deployed in the
cattle-monitoring-systemnamespace. -
Install rancher-monitoring-dashboards chart
To deploy the rancher-monitoring-dashboards chart using the Rancher UI:
-
Select ☰ > Cluster Management.
-
Locate your cluster and click Explore.
-
In the left navigation menu, select Apps > Charts.
-
Locate and select the latest rancher-monitoring-dashboards chart.
-
Click Install.
-
Click Next.
-
The default
values.yamlsets the upstream services name to the default value provided by the upstreamkube-prometheus-stackand NGINX image. When using values provided by the SUSE Application Collection, you must modify the names of the services and the images. Check the SUSE AppCo website for the latest patch of each image minor to take advantage of images with lower CVE impact when configuring. The following is an example with modified chart values:Click to expand
alertmanagerProxy:
  enabled: true
  upstreamPort: 9093
  upstreamService: kube-prometheus-stack-prom-alertmanager
commonLabels: {}
dashboardArtifacts:
  annotations: {}
  cleanupOnUninstall: false
  enabled: true
  groups:
    backupRestore: true
    fleet: true
    ingressNginx: true
    logging:
      fluentbit: true
      fluentd: true
    performance: true
    rancherCore: true
  label: grafana_dashboard
  labelValue: '1'
  namespace: cattle-dashboards
  useExistingNamespace: false
dashboardIntegration:
  grafanaURL: ''
  prometheusURL: ''
defaultRules:
  create: false
etcd:
  enabled: false
extraManifests: []
global:
  cattle:
    clusterId: ''
    clusterName: ''
  clusterDomain: cluster.local
  disableProxyIPv6: false
  imagePullSecrets: ["application-collection"]
  kubectl:
    pullPolicy: IfNotPresent
    repository: rancher/kuberlr-kubectl
    tag: v7.0.1 #The latest minor/version from https://github.com/rancher/kuberlr-kubectl/releases
  rbac:
    create: true
    userRoles:
      aggregateToDefaultRoles: true
      create: true
grafana:
  defaultDashboards:
    namespace: cattle-dashboards
  defaultDashboardsEnabled: true
  enabled: false
  forceDeployDashboards: false
  sidecar:
    dashboards:
      annotations: {}
      label: grafana_dashboard
      labelValue: '1'
grafanaProxy:
  enabled: true
  proxyPath: >-
    /api/v1/namespaces/cattle-monitoring-system/services/http:rancher-monitoring-grafana:80/proxy
  upstreamPort: 80
  upstreamService: kube-prometheus-stack-grafana
hardened:
  enabled: false
  k3s:
    networkPolicy:
      enabled: false
hardenedNodeExporter:
  enabled: false
kubeStateMetrics:
  enabled: false
kubeTargetVersionOverride: ''
monitoringProxy:
  affinity: {}
  image:
    pullPolicy: IfNotPresent
    repository: dp.apps.rancher.io/containers/nginx
    tag: 1.31.5
  nodeSelector: {}
  replicas: 1
  resources:
    limits:
      cpu: 200m
      memory: 256Mi
    requests:
      cpu: 50m
      memory: 64Mi
  tolerations: []
nodeExporter:
  enabled: false
prometheusProxy:
  enabled: true
  upstreamPort: 9090
  upstreamService: kube-prometheus-stack-prom-prometheus
rancherMonitoring:
  enabled: true
  prometheusServiceAccount: kube-prometheus-stack-prom-prometheus
  selector: {}
Depending on your distribution you will also need to add the following modifications to your
values.yamlfile:K3s:k3sServer: enabled: true etcd: enabled: falseRKE2 or distributions with etcd:etcd: enabled: true k3sServer: enabled: false -
Click Install.
Result: Rancher deploys the rancher-monitoring-dashboards chart and integrates the dashboards into the Rancher UI.
Customization and Overrides
Use the configuration settings in this section to customize the rancher-monitoring-dashboards chart for your environment.
-
Override default proxy images. See Monitoring Proxy Image Customization.
-
Align upstream service names with your Prometheus stack and disable unused K3s components. See Service Name Overrides.
Monitoring Proxy Image Customization
A single NGINX pod (monitoringProxy) acts as a proxy for Grafana, Prometheus, and Alertmanager, ensuring the Kubernetes API server’s service proxy (used by the Rancher UI) can reach them reliably. You can customize the NGINX image using the following configuration:
monitoringProxy:
  image:
    repository: <new/image>
    tag: <version>
Service Name Overrides
The default values.yaml assumes standard service naming conventions (for example, kube-prometheus-stack-<application>), as shown below:
grafanaProxy:
  upstreamService: kube-prometheus-stack-grafana

prometheusProxy:
  upstreamService: kube-prometheus-stack-prometheus

alertmanagerProxy:
  upstreamService: kube-prometheus-stack-alertmanager
This creates mirror services alongside the new chart, which the reverse proxy uses to enable Rancher UI functionality. If you modified the service names during installation, update the upstreamService configuration accordingly:
grafanaProxy:
  upstreamService: <upstream_service_name>

prometheusProxy:
  upstreamService: <upstream_service_name>

alertmanagerProxy:
upstreamService: <upstream_service_name>|
Make sure to disable |
FAQ
Q: What is the new chart being introduced?
A: The rancher-monitoring-dashboards chart includes only dashboard artifacts and Rancher UI integration metadata. It does not include Prometheus, Grafana, Alertmanager, exporters, or PushProx. To deploy a full monitoring runtime, install kube-prometheus-stack separately from the Prometheus Community Helm repository.
Q: Will the legacy rancher-monitoring chart still be available?
A: Yes. Rancher v2.15 retains the Rancher v2.14 version of the rancher-monitoring chart, but you cannot install it directly as a new installation. Rancher v2.15 also includes an updated monitoring version available exclusively for upgrades.
Q: What happens to existing installations when upgrading to Rancher v2.15?
A: You can upgrade existing installations to the updated monitoring release in Rancher v2.15. To migrate fully to the new dashboards-only chart, follow the standard upstream migration path for Prometheus and Grafana.
Q: How does the Rancher UI locate Grafana and Prometheus?
A: In this release, monitoring service URLs (such as rancher-monitoring-<service>) remain hardcoded in the Rancher UI. Support for configurable, user-provided URLs is planned for a future release.
Q: How does the Rancher UI monitoring installation workflow change?
A: The Rancher UI installation workflow uses kube-prometheus-stack for runtime configuration options. The rancher-monitoring-dashboards chart exposes values only for dashboards and Rancher UI integration.
Rancher Monitoring
|
The |
The rancher-monitoring application can quickly deploy leading open-source monitoring and alerting solutions onto your cluster.
Introduced in Rancher v2.5, the application is powered by Prometheus, Grafana, Alertmanager, the Prometheus Operator, and the Prometheus adapter.
Using the rancher-monitoring application, you can quickly deploy leading open-source monitoring and alerting solutions onto your cluster.
Features
Prometheus lets you view metrics from your Rancher and Kubernetes objects. Using timestamps, Prometheus lets you query and view these metrics in easy-to-read graphs and visuals, either through the Rancher UI or Grafana, which is an analytics viewing platform deployed along with Prometheus.
By viewing data that Prometheus scrapes from your cluster control plane, nodes, and deployments, you can stay on top of everything happening in your cluster. You can then use these analytics to better run your organization: stop system emergencies before they start, develop maintenance strategies, or restore crashed servers.
The monitoring application:
-
Monitors the state and processes of your cluster nodes, Kubernetes components, and software deployments.
-
Defines alerts based on metrics collected via Prometheus.
-
Creates custom Grafana dashboards.
-
Configures alert-based notifications via email, Slack, PagerDuty, etc. using Prometheus Alertmanager.
-
Defines precomputed, frequently needed or computationally expensive expressions as new time series based on metrics collected via Prometheus.
-
Exposes collected metrics from Prometheus to the Kubernetes Custom Metrics API via Prometheus Adapter for use in HPA.
See How Monitoring Works for an explanation of how the monitoring components work together.
Deploying Prometheus Federator with SUSE Application Collection
|
If installing using the UI ensure all required fields under the Project Monitoring Chart and Grafana Chart tabs are filled respective to your values.yaml configuration, note the example UI view below. This changes the images, not the chart. At the moment it is not possible to choose what version of the Grafana chart is installed.
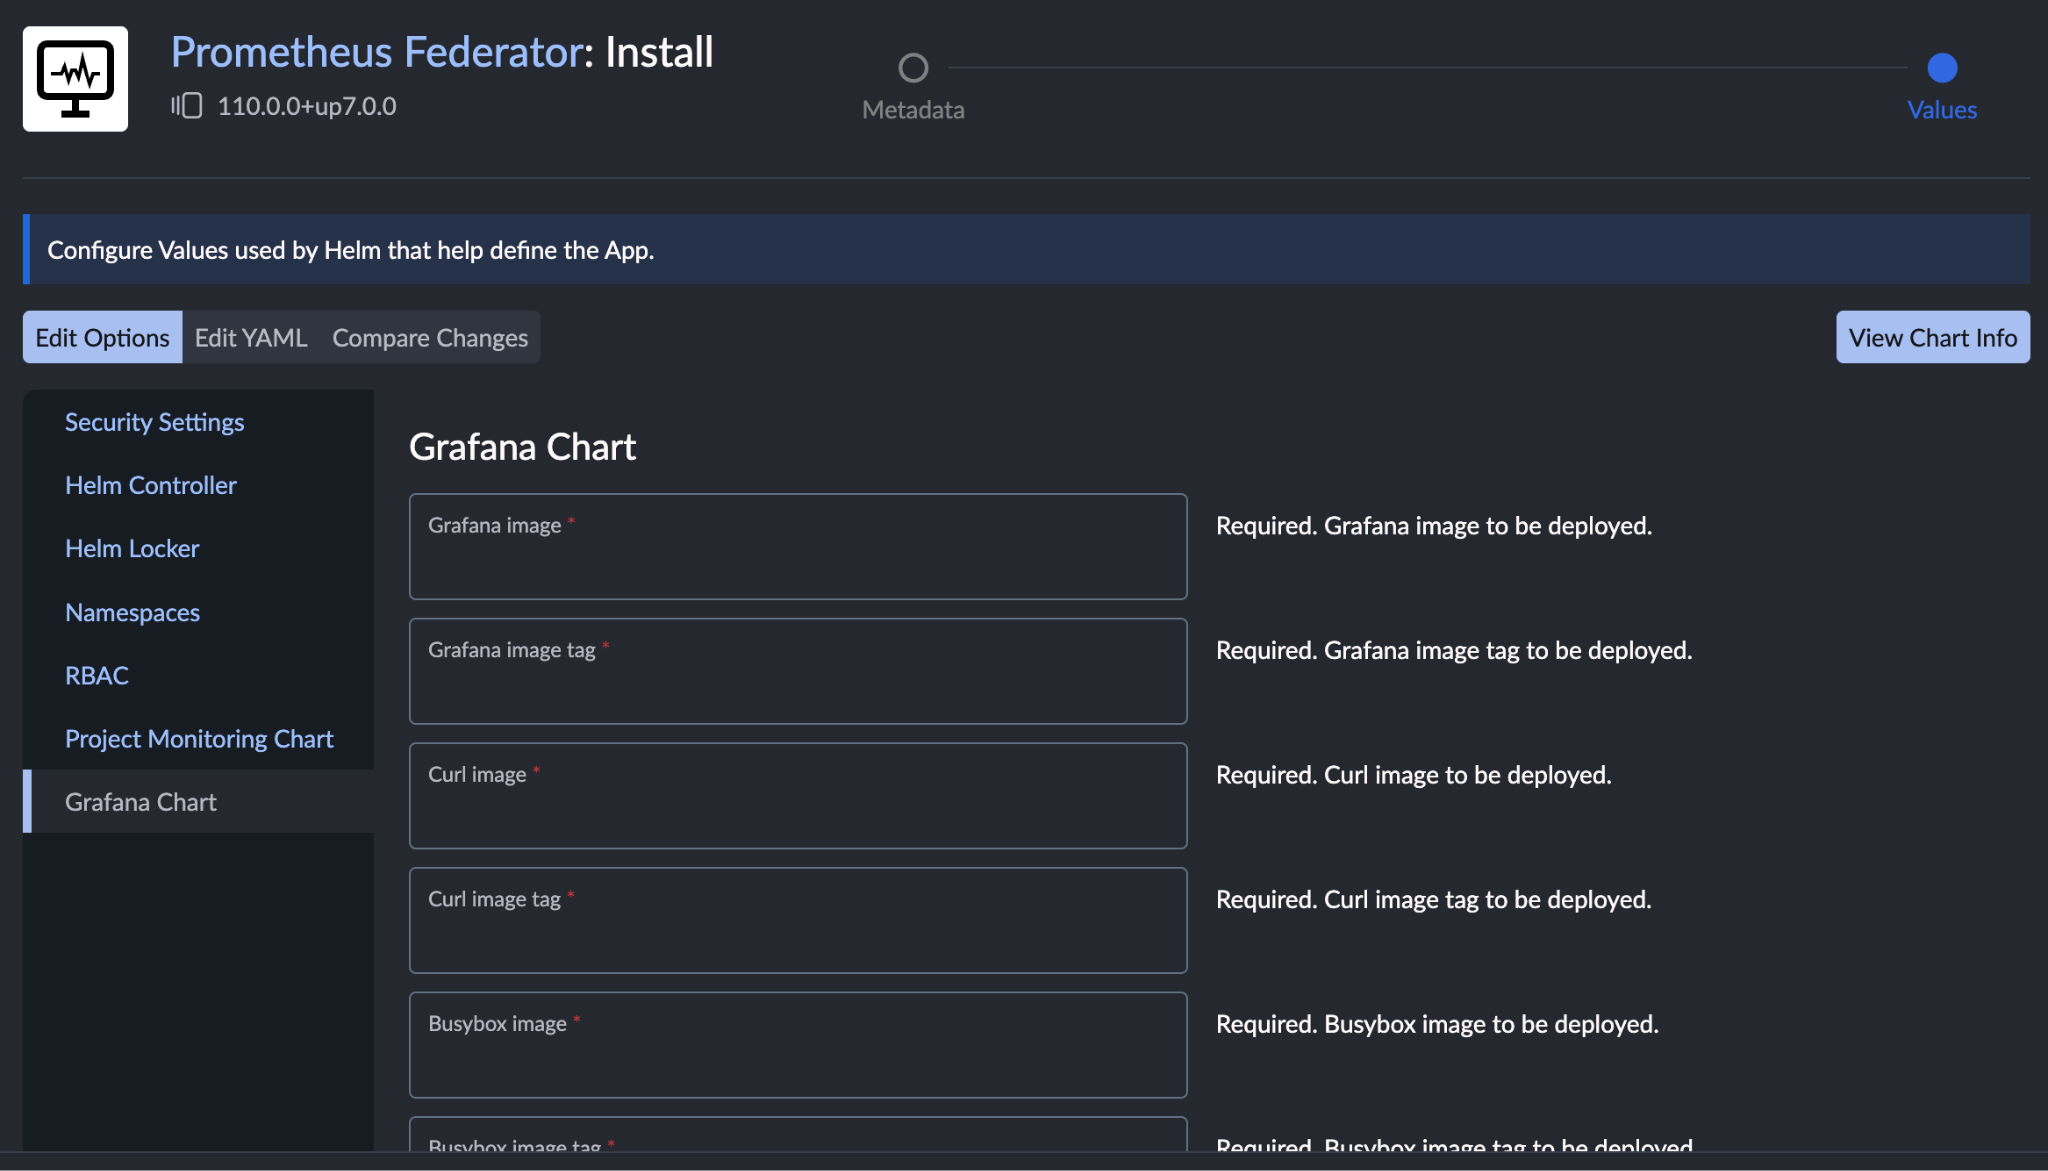
To supply the required Prometheus, Grafana, and Alertmanager images via Helm, specify them under helmProjectOperator.valuesOverride when deploying Prometheus Federator. Check the SUSE AppCo website for the latest patch of each image minor to take advantage of images with lower CVE impact when configuring:
helmProjectOperator:
  valuesOverride:
    grafana:
      downloadDashboardsImage:
        repository: dp.apps.rancher.io/containers/curl
        tag: 8.14.1
      image:
        repository: dp.apps.rancher.io/containers/grafana
        tag: 12.3.1
      imageRenderer:
        image:
          repository: dp.apps.rancher.io/containers/grafana-image-renderer
          tag: v5.1.0
      initChownData:
        image:
          repository: dp.apps.rancher.io/containers/bci-busybox
          tag: 1.31.1
      sidecar:
        image:
          repository: dp.apps.rancher.io/containers/k8s-sidecar
          tag: 2.1.2
  chartSource:
    name: rancher-project-monitoring
    repo: https://raw.githubusercontent.com/rancher/ob-team-charts/refs/heads/main
    version: 1.0.0
Pushprox alternative using Prometheus Agent
Previous versions of rancher-monitoring relied on a Rancher-maintained fork of PushProx to scrape metrics from components that bind exclusively to port 127.0.0.1. These components include:
-
kube-proxy -
etcd -
kube-scheduler -
kube-controller-manager
This localhost binding strategy is standard across Kubernetes distributions, including K3s and RKE2, and aligns with CIS benchmark recommendations. Upstream PushProx lacks the custom features present in the Rancher fork, making it an unsuitable replacement.
Note that authentication behavior varies across components:
-
kube-schedulerandkube-controller-managerrequire a valid bearer token for scrape requests. -
kube-proxyandetcddo not enforce authentication, which remains secure because scrape requests operate entirely over the local loopback interface.
To collect these local metrics, deploy a Prometheus Agent on each control-plane node. The agent scrapes all four targets over loopback and forwards the collected metrics to the primary Prometheus instance via remote_write. This approach avoids creating new listening ports or exposing control-plane network interfaces, offering a safer alternative to tools like socat.
-
First enable
remote-writeon the previously installedkube-prometheus-stack chart:helm upgrade kube-prometheus-stack oci://dp.apps.rancher.io/charts/prometheus-operator \ -n cattle-monitoring-system --reuse-values \ --set prometheus.prometheusSpec.enableRemoteWriteReceiver=true \ --wait -
Create the service that the Prometheus Agent will use to send metrics to the main Prometheus instance:
apiVersion: v1 kind: Service metadata: name: kube-prometheus-stack-prom-prometheus-write namespace: cattle-monitoring-system spec: selector: app.kubernetes.io/name: prometheus operator.prometheus.io/name: kube-prometheus-stack-prom-prometheus ports: - name: remote-write port: 9091 targetPort: 9091 -
Create the CRD for the Prometheus Agent:
apiVersion: monitoring.coreos.com/v1alpha1 kind: PrometheusAgent metadata: name: control-plane-agent namespace: cattle-monitoring-system spec: replicas: <number_of_replicas> hostNetwork: true listenLocal: true serviceAccountName: kube-prometheus-stack-prom-prometheus nodeSelector: node-role.kubernetes.io/control-plane: "true" tolerations: - operator: Exists affinity: podAntiAffinity: requiredDuringSchedulingIgnoredDuringExecution: - labelSelector: matchLabels: app.kubernetes.io/name: prometheus-agent operator.prometheus.io/name: control-plane-agent topologyKey: kubernetes.io/hostname scrapeConfigSelector: matchLabels: control-plane-agent: "true" remoteWrite: - url: https://kube-prometheus-stack-prom-prometheus-write.cattle-monitoring-system.svc:9091/api/v1/write authorization: type: Bearer credentialsFile: /var/run/secrets/kubernetes.io/serviceaccount/token tlsConfig: insecureSkipVerify: true -
Create the
ScrapeConfigthat matches thescrapeConfigSelectorabove:apiVersion: monitoring.coreos.com/v1alpha1 kind: ScrapeConfig metadata: name: control-plane-agent-kube-proxy namespace: cattle-monitoring-system labels: control-plane-agent: "true" spec: jobName: kube-proxy staticConfigs: - targets: ["127.0.0.1:10249"] --- apiVersion: monitoring.coreos.com/v1alpha1 kind: ScrapeConfig metadata: name: control-plane-agent-kube-etcd namespace: cattle-monitoring-system labels: control-plane-agent: "true" spec: jobName: kube-etcd staticConfigs: - targets: ["127.0.0.1:2381"] --- apiVersion: monitoring.coreos.com/v1alpha1 kind: ScrapeConfig metadata: name: control-plane-agent-kube-scheduler namespace: cattle-monitoring-system labels: control-plane-agent: "true" spec: jobName: kube-scheduler scheme: HTTPS tlsConfig: insecureSkipVerify: true authorization: credentials: name: kube-prometheus-stack-prom-prometheus-token key: token staticConfigs: - targets: ["127.0.0.1:10259"] --- apiVersion: monitoring.coreos.com/v1alpha1 kind: ScrapeConfig metadata: name: control-plane-agent-kube-controller-manager namespace: cattle-monitoring-system labels: control-plane-agent: "true" spec: jobName: kube-controller-manager scheme: HTTPS tlsConfig: insecureSkipVerify: true authorization: credentials: name: kube-prometheus-stack-prom-prometheus-token key: token staticConfigs: - targets: ["127.0.0.1:10257"]
At this point, the Prometheus Agent is fully configured to scrape metrics from the control-plane components and forward them to the existing Prometheus instance.
Optional Security Hardening
Prometheus' remote_write receiver (--web.enable-remote-write-receiver) lacks built-in authentication capabilities, and prometheus-operator does not currently provide a CRD field to configure receiver authentication. For more details on this limitation, refer to the upstream prometheus-operator issue.
Leaving the receiver unauthenticated exposes the endpoint and increases the cluster’s attack surface. To mitigate this risk, deploy kube-rbac-proxy as a sidecar container to enforce RBAC authentication and authorization in front of the remote_write receiver.
-
First create the
configmapthat will hold the configuration file for the proxy:kubectl create configmap kube-rbac-proxy-remote-write-config \ -n cattle-monitoring-system \ --from-literal=config-file.yaml='authorization: resourceAttributes: namespace: cattle-monitoring-system apiVersion: v1 resource: services subresource: remote-write name: kube-prometheus-stack-prom-prometheus-write' -
Give the appropriate permissions to the
serviceAccount:apiVersion: rbac.authorization.k8s.io/v1 kind: ClusterRoleBinding metadata: name: kube-prometheus-stack-prom-prometheus-auth-delegator subjects: - kind: ServiceAccount name: kube-prometheus-stack-prom-prometheus namespace: cattle-monitoring-system roleRef: kind: ClusterRole name: system:auth-delegator apiGroup: rbac.authorization.k8s.io --- apiVersion: rbac.authorization.k8s.io/v1 kind: ClusterRole metadata: name: control-plane-agent-remote-write rules: - apiGroups: [""] resources: ["services/remote-write"] resourceNames: ["kube-prometheus-stack-prom-prometheus-write"] verbs: ["create"] --- apiVersion: rbac.authorization.k8s.io/v1 kind: ClusterRoleBinding metadata: name: control-plane-agent-remote-write subjects: - kind: ServiceAccount name: kube-prometheus-stack-prom-prometheus namespace: cattle-monitoring-system roleRef: kind: ClusterRole name: control-plane-agent-remote-write apiGroup: rbac.authorization.k8s.io -
Lastly, in the
kube-prometheus-stackchart, underprometheus.PrometheusSpec.containersadd the following:containers: - name: kube-rbac-proxy-remote-write image: dp.apps.rancher.io/containers/kube-rbac-proxy:0.23.0 args: - --secure-listen-address=0.0.0.0:9091 - --upstream=http://127.0.0.1:9090/ - --config-file=/etc/kube-rbac-proxy/config-file.yaml - --logtostderr=true - --v=2 ports: - containerPort: 9091 name: remote-write volumeMounts: - name: kube-rbac-proxy-config mountPath: /etc/kube-rbac-proxy resources: requests: { cpu: 10m, memory: 32Mi } limits: { cpu: 100m, memory: 64Mi } volumes: - name: kube-rbac-proxy-config configMap: name: kube-rbac-proxy-remote-write-config-
Port numbers 10249, 10257, 10259, 2381, node role labels, and whether kube-proxy is loopback-bound can differ by distribution and Kubernetes version. Check with
ss -tlnon a node directly before using the configuration outside of K3s or RKE2. -
Resources requests and limits are examples and should be configured based on the cluster size and workload requirements.
-
Default Components and Deployments
Built-in Dashboards
By default, the monitoring application deploys Grafana dashboards (curated by the kube-prometheus project) onto a cluster.
It also deploys an Alertmanager UI and a Prometheus UI. For more information about these tools, see Built-in Dashboards.
Default Metrics Exporters
By default, Rancher Monitoring deploys exporters (such as node-exporter and kube-state-metrics).
These default exporters automatically scrape metrics for CPU and memory from all components of your Kubernetes cluster, including your workloads.
Default Alerts
The monitoring application deploys some alerts by default. To see the default alerts, go to the Alertmanager UI and click Expand all groups.
Components Exposed in the Rancher UI
For a list of monitoring components exposed in the Rancher UI, along with common use cases for editing them, see this section.
Role-based Access Control
For more information on configuring access to monitoring, see this page.
|
Rancher and Project read permissions don’t necessarily apply to monitoring resources. See monitoring-ui-view for more details. |
Configuration
Configuring Monitoring Resources in Rancher
The configuration reference assumes familiarity with how monitoring components work together. For more information, see How Monitoring Works.
Configuring Helm Chart Options
For more information on rancher-monitoring chart options, including options to set resource limits and requests, see Helm Chart Options.
Windows Cluster Support
To be able to fully deploy Monitoring V2 for Windows, all of your Windows hosts must have a minimum wins version of v0.1.0.
For more details on how to upgrade wins on existing Windows hosts, see Windows cluster support for Monitoring V2..
Known Issues
There is a known issue that K3s clusters require more than the allotted default memory. If you enable monitoring on a K3s cluster, set prometheus.prometheusSpec.resources.memory.limit to 2500 Mi and prometheus.prometheusSpec.resources.memory.request to 1750 Mi.
See Debugging High Memory Usage for advice and recommendations.